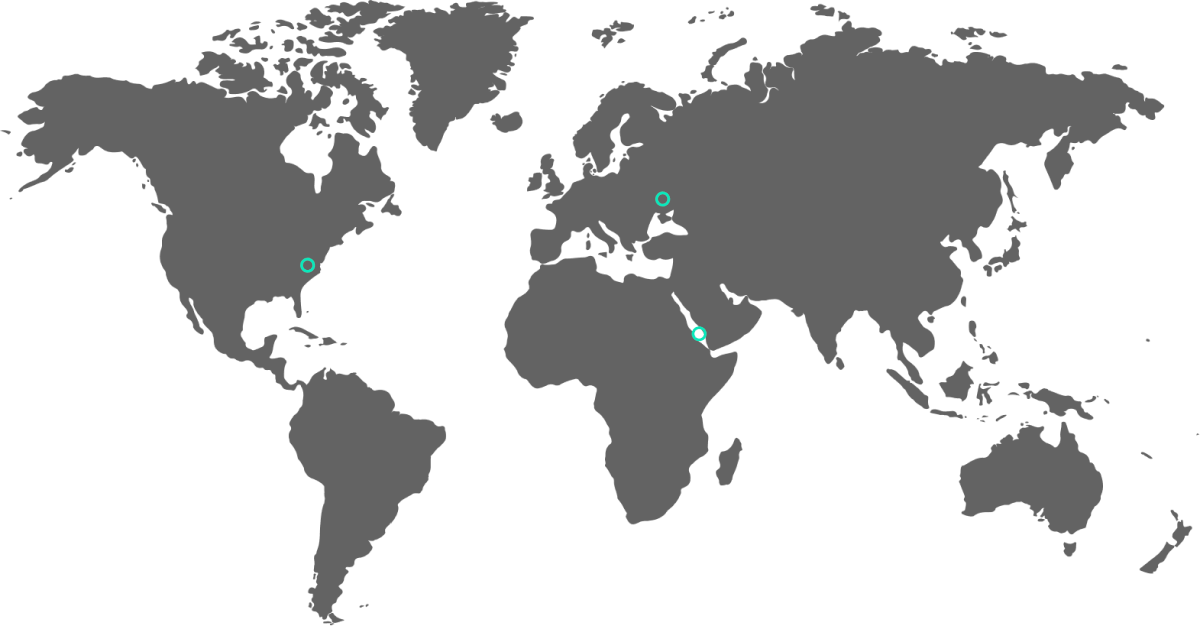
Media Metrics for Businesses to Use with Caution, If at All
In my last blog post, I discussed several common media metrics that should guide day-to-day communications activities. Building upon that topic, let’s dive into some other metrics that have been the staple of many corporate communications operations – yet need to be reconsidered in today’s real-time, data-driven media environment.
For example, several media metrics are popular with businesses, but they do not necessarily show the impact of your communications efforts. Some, such as Share of Voice, can be used cautiously, in combination with other metrics to paint a picture of your media landscape. Others, such as Ad Value Equivalents, should be avoided because they do not show ways to optimize your strategy and help ensure that your target audiences hear your messages.
In other words, these “results” metrics might provide dollar amounts or large numbers, but they do not deliver a road map to insights to help you make strategic communications decisions.
As an analogy, when you take a road trip, you typically tally the number of miles that you drove for the day. Those miles are the results of your driving efforts.
If you use GPS, you will also be advised if there is a better route to take to make your journey better – perhaps there are breathtaking viewpoints to enjoy or maybe a different direction will avoid traffic jams. The GPS gives you insights that the odometer does not.
In this same way, meaningful metrics provide numbers (quantitative results) that should be analyzed to find insights (qualitative outcomes) to drive strategy. So be sure to find metrics that matter and use others with caution or simply steer clear of them.
The examples we will explore in this post are Impressions, Ad Value Equivalents (AVEs) and Share of Voice (SOV).
Impressions
Some businesses love impressions (sometimes referred to as “reach”) because the numbers can be massive. But impressions lack substance, and do not provide that road map to help drive your strategic decision-making.
Contrary to popular belief, impressions and reach do not represent brand awareness. These so-called “vanity metrics” simply show the potential eyeballs on your content, not the actual number of people viewing it and becoming aware of your brand. For example, when someone with 50,000 followers posts on Twitter, how many of these followers actually see the tweet?
There doesn’t appear to be any accurate data on exactly what percentage of your target audience is reached, so the number of followers or fans means little. What matters is the number of them who engage with your content and your social channels. What are they saying about your company, your brand and your products and services? How many discussed your messages or the topics that are most important to you? Who are your advocates and influencers?
Another question to consider: which of these two posts better demonstrates success?
- A brief mention in a general post on a high-impressions website
- A thoughtful placement that contains your key messages on a website with lower impressions, yet frequented by your target audience
One final question: The population in the U.S. is 326 million people, so what does it mean when a video about a product sold only in this country generated three billion impressions?
If your C-Suite wants to see this large, “sexy” number, go ahead and use the metric. But use it in context, providing the reasons why this result demonstrates the impact of your communications strategies.
Ad Value Equivalents
Ad value equivalents (AVEs) do not measure the value of public relations, marketing or any communications activities. AVEs do not help you make decisions on future strategy either. Similar to impressions, AVEs do not equal brand awareness. AVEs do not show you if coverage and conversations recommend your brand or encourage people to do business with you.
AVEs attribute a dollar value to media coverage, based on the cost of column inches to purchase space in a newspaper or magazine, or the price of a broadcast commercial. Decades ago, when AVEs were first adopted, media space was limited; this is not the case in a digital age. More importantly, do you consider your work to be advertising?
In recent years, many global measurement organizations, agencies and corporations have agreed that the value of public relations cannot be solely equated with the cost of advertising. This is based on The Barcelona Principles – adopted in 2010 and updated in 2015 – which represent an industry-wide consensus on the basic principles of communications measurement.
According to the principles, “Advertising Value Equivalents do not measure the value of PR and do not inform future activity; they measure the cost of media space or time and are rejected as a concept to value communication, media content, earned media, public relations, etc.”
Instead of using AVEs, develop a media quality index that evaluates your coverage and conversations based what’s important to you; connect the index to your goals and your definition of performance success.
Share of Voice as a Stand-alone Metric
Share of Voice (SOV) is perhaps the most common metric that every PR professional includes in their regular cadence of reporting. SOV is the percentage of coverage and conversations about your brand compared to your competitors. But, as mentioned in my previous post, SOV lacks relevance without context. For example, a competitor in the midst of a crisis, or even during a popular event, will likely have a higher SOV than your brand.
I once had a client that generated the highest monthly volume of coverage in its history, yet its SOV decreased because of widely discussed protests held at one competitor’s headquarters. This demonstrates that you cannot control your own percentage-of-coverage against competitors.
It makes more sense to benchmark metrics against yourself – compare your increase in mentions over time, and understand the reasons for those hikes and declines. You can do the same analysis for your competitors’ coverage. Once you understand the quality of your coverage, and then compare this knowledge to the effect of tactics used by your competitors, you can make better decisions about your future plans.
Of note, SOV is fine to use as a metric in combination with others, so you know what activities or messages contributed to your competitors’ SOV, and you can spot trends and consistently evaluate perceptions. Better yet, slice and dice the metric in different ways, including share by top-tier site, by topic and by media channel.
But don’t use it as a stand-alone metric, or you will find yourself in the same situation as my client – trying to explain to her Chief Communications Officer why their SOV decreased despite their best communications work in the history of their company.
Summary
You can find dozens of metrics to slice and dice media data – but that approach will likely return an overwhelming amount of information that might not be valuable, and therefore has the potential to waste your time and money. Instead, choose a few metrics that align with your business and communications goals, and make sure they result in insights to help you drive future strategy. There is a reason the recently popular phrase “metrics that matter” has become an axiom in the communications industry.
If you would like to learn more about how to take a data-driven approach to communications, download our eBook.
—
Margot Sinclair Savell is an award-winning writer who has decades of experience crafting and editing content. During 15 years at agencies such as Hill+Knowlton Strategies and Weber Shandwick, she specialized in strategic counsel for measurement, insights and analytics. In 2016, she was inducted into the PR Measurement Hall of Fame.
- Categories: